Release 3.0 · Day 4 — Territory Studio: Stop Drawing Territories in PowerPoint 🗺️
Map-based territory design, real-time capacity analysis, and an AI coach that flags overlap, gaps, and overload.
If you're a sales manager, you've drawn territories. In PowerPoint. Or worse, in a paper map taped to a wall. Then a rep quits, you re-draw the whole thing, and three months later half your customers think they've been forgotten.
Territory Studio fixes this once. Build territories on a real map, see who has too many customers and who has spare capacity, and let the system coach you on what to fix.
✏️ Three ways to build a territory
- Draw it yourself — click corners on the map, name it, assign a rep, save.
- Auto-build from clusters — let the system group each rep's existing customers into a sensible polygon. Edit afterwards.
- Auto-build for one rep — perfect for onboarding a new team member without redrawing the whole org.
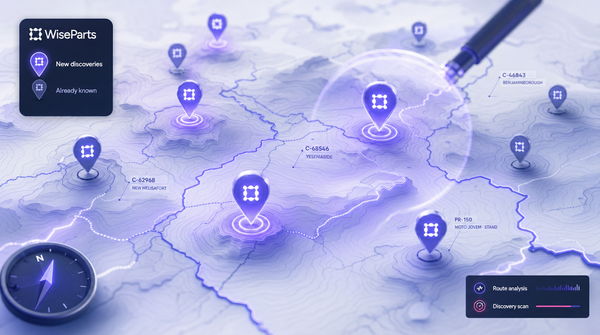
Every territory is colored by its rep. Customers on the map match. Outliers get a dashed ring so you can spot them at a glance.
📊 Real-time capacity, finally
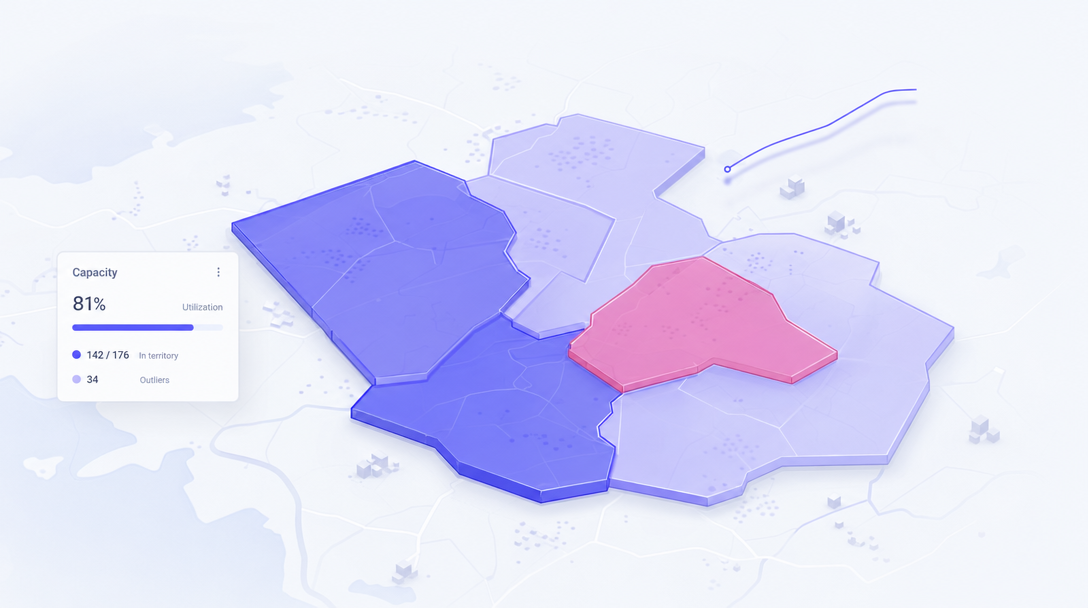
Each rep's sidebar card shows their utilisation in plain numbers — visits per day, working days per month, customer count, 12-month sales.
Color-coded heat: blue means spare capacity, red means overloaded, and the bar updates the second you reshape a polygon.
🧑🏫 The Coach finds what you missed
The Coach panel surfaces issues automatically:
- Coverage gaps (purple) — territory is too thin
- Under-covered (blue) — rep has spare capacity
- Over-loaded (red) — too many customers for one rep
- Overlaps (amber) — two territories fighting for the same customer
Click any recommendation and the system suggests a fix — geographic balancing or owner-priority — that you can apply to one rep or to all of them at once.
💡 Pro Tip: Use Auto Build to get a baseline, then edit. The algorithm gets you 80% of the way; your knowledge of who-knows-who handles the rest.
Already on WiseParts? Read the Territory Studio docs →
New here? Book a demo →